
Markets
When Will Stock Markets Recover: Bright Prospects
Curious when stock markets recover? Historical rebounds and expert forecasts hint at change, leaving investors wondering what twist awaits next.
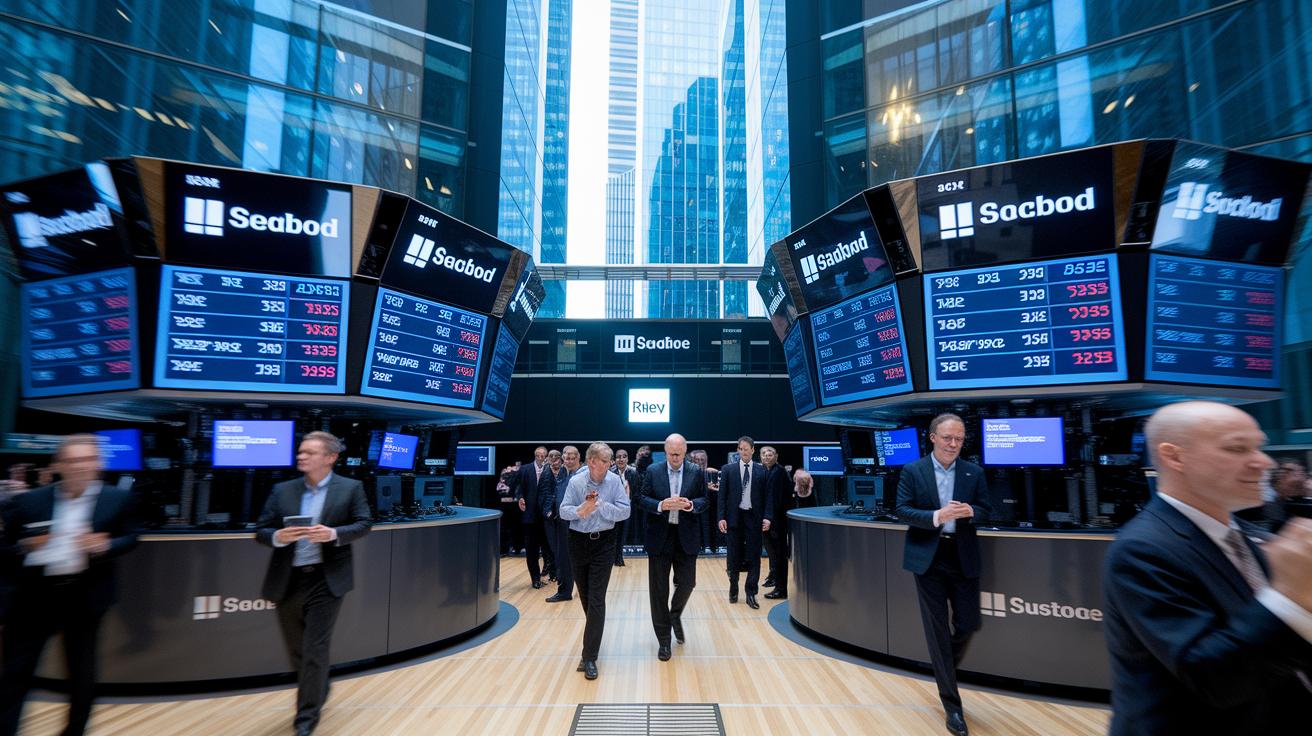
Ever wondered if the stock market can bounce back after a big drop? History tells us that even when things fall hard, they eventually pick up again. Remember the 2008 slump? The market got back on its feet in just a few years, and even smaller drops have fixed themselves up even quicker.
Now, experts are saying that if nothing major disrupts the scene, we could see smoother days returning by mid-2025. This article looks at past patterns and what experts think helps us get a clearer picture of when stability might return.
Stick around to see how old market trends can help guide your choices today.
When Will Stock Markets Recover: Bright Prospects
When we look back at past market cycles, we see clues that help us understand future moves. For example, after the 2008 crash, the S&P 500 bounced back by March 2011 – about 36 months later. Smaller drops, those under 20%, usually settle in a few weeks or months. On the other hand, deeper falls over 20% have taken one to three years to recover. This tells us that the bigger the drop, the longer the comeback might be, giving us a clear timeline based on past trends and today’s market feel.
Recent surveys from market experts hint that if we avoid any big shocks, things might settle down and get back to normal by mid-2025. These guesses come from looking at past recoveries and watching how smaller dips recover quickly. Experts look at things like how the mood in the market is, overall economic trends, and steadying price changes to make these calls. They remind us that while a quick drop can be nerve-wracking, history shows strong recoveries usually follow. All in all, the outlook looks bright, so a patient approach might be best as we ride out the ups and downs towards long-term growth.
Historical Patterns of Equity Revival

Investors have noticed that after a drop, markets tend to bounce back in different ways. When the dip is less than 20%, it can cause a quick spike in market jitters (like a sudden buzz that calms down in a few weeks). But when the fall is deeper, history shows that the road to recovery takes a bit longer. For example, after the 1987 Black Monday, it took about two years for the market to get back on track. The 2008 financial crisis needed around three years until March 2011 to regain its momentum, while the COVID-19 drop in March 2020 sparked a sharp, V-shaped rebound that erased losses by August 2020. If you’re curious, you can look up more details on how stock markets work.
1987 Black Monday Recovery
Back in 1987, the market took a big hit and then slowly found its footing. It took close to two years. This period taught many investors that smaller corrections might come and go quickly, but the harder falls need a steadier, more gradual comeback. It’s a good reminder to keep a long-term view even during tough times.
2008 Financial Crisis Rebound
During the 2008 crisis, stocks fell deeply, and the recovery spanned roughly 36 months. It was a time of struggle mixed with eventual growth. This slow but steady rebound shows that when the drop is steep, it takes extra time and strong fundamentals to rebuild confidence and restore value.
COVID-19 Dip and V-Shaped Rally
In March 2020, COVID-19 sent the market into a sudden downturn. But, in a surprising twist, the market bounced back quickly, a V-shaped rally turned things around by August 2020. This quick recovery reminds us that sometimes a shock can be very short-lived when market conditions and investor sentiment realign just right.
Critical Economic Indicators Shaping the Recovery
Hey there. If you’re looking at the big picture and wondering if calmer market days are ahead, there are a few must-watch signs that can help clear things up. For example, when the GDP grows above 2.5%, it means our economy is expanding and everyday spending is on the rise. That growth often brings more stable jobs and a bit of relief for households.
Unemployment dropping under 6% is another comforting sign. When more people are finding work, it boosts community confidence and spending power. And then there’s the PMI rising above 50, which is just a way of saying that managers at companies are feeling optimistic about business. More orders and investments might soon follow, which is pretty encouraging.
You’ll also want to keep an eye on corporate bond spreads. When these spreads narrow, it tells us that investors see less risk when lending to companies, keeping borrowing costs low and making it easier for businesses to plan growth. And finally, if the VIX drops below 20, it usually means the market is calming down, giving investors a bit more peace of mind.
Each of these indicators plays its part, like different instruments in an orchestra, coming together to create a harmonious signal that our economic recovery is gaining momentum. Keeping watch on these can help reassure you that a brighter market might be just around the corner.
Below are the top five pivotal economic indicators often used to gauge when markets might turn more positive:
| Indicator | What It Tells Us |
|---|---|
| GDP growth above 2.5% | The economy is on the rise, with more spending by households and businesses. |
| Unemployment falling under 6% | More people are finding work, boosting financial stability and consumer confidence. |
| PMI rising above 50 | Managers feel optimistic, suggesting increased business activity and investment. |
| Corporate bond spreads narrowing | Investors see less risk, keeping borrowing costs low for businesses. |
| VIX dropping below 20 | A calmer market, which can give investors more confidence in their decisions. |
Impact of Monetary Policy and Fiscal Stimulus on Market Revival
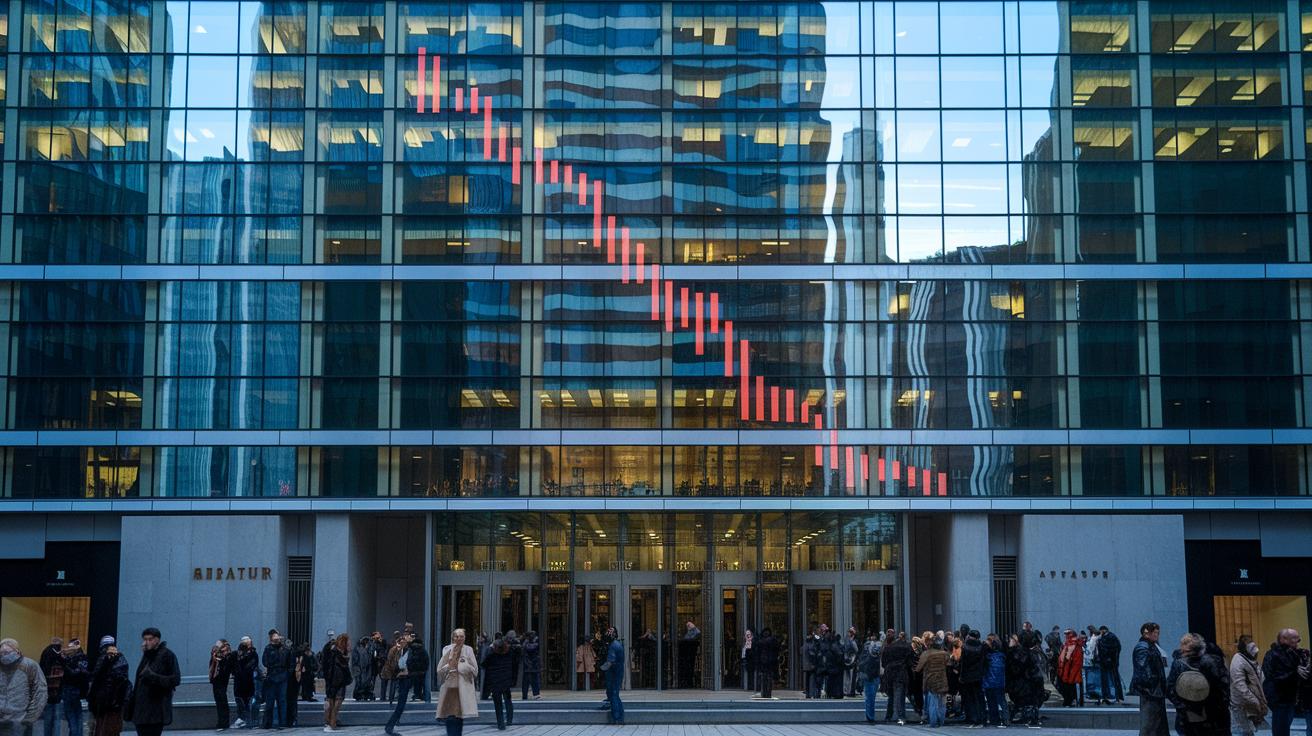
Central bank moves really shape how quickly markets settle down. When the Fed cuts rates, it makes borrowing cheaper. This means businesses and individuals can grab loans more easily to boost their growth. Since 2009, the Fed’s quantitative easing (that’s when they pump extra money into the system to help keep things moving) grew its balance sheet by over $4 trillion. That extra cash helped lift stock values. Plus, big government spending, like the $2.2 trillion CARES Act in 2020, gave the economy a real push after the COVID setback. All these actions work together to make things feel a bit calmer by building confidence and offering extra support when times get shaky.
Government policy changes also have a big impact on how investors act. Small tweaks like tariff shifts or new rules can quickly change market moods, sometimes easing concerns, and other times sparking worries about future costs. Sometimes you even see these confidence boosts reflected in trends that track how investors feel. When these policies hit the mark, they don’t just keep everyday market activity on track, but also help guide longer-term expectations toward a steadier future.
Analyst Forecasts and Quantitative Models for Recovery
Advanced models, like regression (a math tool that spots patterns in data) and turnaround projection models, give us a simple way to see what a market recovery might look like. Analysts study past trends with these data-driven recovery studies. They look at momentum (the strength of stock movements) and value signals (clues to a stock’s worth) to spot key turning points in the market. Recent findings suggest that recoveries usually take about 14 to 18 months on average. For example, a 2024 survey showed that 60% of 50 economists think the market will be strong again by the second quarter of 2025. This careful work with numbers shows that changes in stock sentiment provide good hints about when a steady market climb might begin.
Besides the models, shifts in investor feelings also play a big role in these predictions. When investor confidence climbs above 50%, it has often come right before a market improvement. Breaking down factors like momentum and value helps pinpoint the moment when the market is ready for a bounce. These recovery forecasts combine detailed analysis with real market trends, giving a balanced view that feels both precise and practical. This mix of data and sentiment can boost confidence in a recovery timeline and gives investors a clear plan to follow while offering hope for a steady improvement in market conditions.
Potential Recovery Scenarios and Risk Profiles

When we think about how the market might bounce back, several different paths come to mind. Each route has its own timing and set of challenges. One possibility is steady, moderate growth. Here, the market could recover in about 18 months with inflation staying around 2–3% and a calm, low-volatility environment. It paints a picture of a gradual, steady return to higher values.
Another option is a tougher road where inflation stays above 4% and interest rates rise. This scenario might stretch the recovery beyond 36 months and bring conditions similar to what we see in bear corrections (times when prices drop). It’s a reminder that growth can sometimes come with bumps along the way.
Then there’s the chance of a soft landing that triggers a quick, V-shaped rebound in just 6–9 months. It offers a fast, sharp turnaround that many investors might find appealing, even if it doesn’t last long.
There’s also the risk that an unexpected shock could cause a double-dip correction. In this case, the market could drop again after an initial recovery before finally turning around. Each of these paths has its own blend of risks and rewards.
Understanding these different outcomes and their chances can help you adjust your strategy and protect your investments during uncertain times.
| Scenario | Timeline | Key Risks | Probability |
|---|---|---|---|
| A | 18 months | Low volatility; moderate inflation | High |
| B | Over 36 months | Persistent inflation; higher rates | Medium |
| C | 6–9 months | V-shaped rebound risk | Low |
| D | Varies | New external shock | Medium |
Portfolio Strategy Adjustments Before Market Upswing
When it looks like the market is beginning to climb back, you might want to think about moving some of your money into areas that typically rebound quickly, like technology and consumer choice items. Shifting a bit of your investments into these sectors can help smooth out your gains when the recovery really takes off. You could consider putting about 10–20% into strong companies that do well even in shaky times.
A lot of folks use tools like stop-loss orders or protective puts (which are methods that automatically sell stocks when they drop too much) to help protect their investments during rough patches. For example, checking out stock market futures as a way to hedge can give you an extra layer of safety as you wait for the market to clear up.
Then, think about readjusting your mix so you have about 60% in stocks and 40% in bonds. This blend helps you grab some of the gains from the market while bonds add steady support. Basically, you get a mix where the bolder part of your money rides the market upswing and the safer part holds things steady. These simple changes, along with careful risk management, can be a smart plan for getting ready for the next market rise.
Final Words
In the action, the article explored projected timelines for stock market recovery by reviewing historical patterns like the rebounds following Black Monday, the 2008 crisis, and the COVID-19 dip. It highlighted key economic indicators, the role of monetary policy, and expert forecasts that help answer the question: when will stock markets recover?
By combining data-driven insights and practical portfolio strategies, readers gain guidance on managing risks while preparing for a financial upswing. It’s reassuring to see clear steps toward secure, smart financial growth.
FAQ
What is the stock market forecast for the next 6 months?
The stock market forecast for the next six months is based on current trends and economic data. Analysts expect steady recovery but caution that market shifts are always possible.
What is the next stock market crash prediction?
The prediction of the next market crash comes from monitoring volatility and risk signals. However, pinpointing a crash is challenging as market conditions can change quickly.
What is the stock market prediction for the next 5 years?
The five-year stock market prediction is built on historical recovery rates and expert models. Experts see potential for growth if no major economic shocks occur during that period.
What does the term “Trump stock market” indicate?
The term “Trump stock market” refers to market movements linked with policies from former President Trump, affecting investor sentiment and triggering discussions about political impact on stocks.
What does a stock market drop mean?
A stock market drop means quickly falling stock prices, usually due to short-term market corrections or shocks. History shows that such drops are often followed by steady recovery.
What are the US stock market predictions for tomorrow?
The US stock market predictions for tomorrow depend on current economic news and trading trends. Short-term forecasts can be volatile, reflecting quick changes in investor mood.
How long will it take for the stock market to recover?
Recovery time varies; mild downturns may bounce back in weeks while deeper crashes have taken one to three years in the past. Historical data and current conditions drive these estimates.
Should I pull my money out of the stock market?
The decision to withdraw money from the stock market should match your personal financial goals and risk tolerance. Past trends suggest that staying invested often benefits long-term growth.
Will the stock market ever rise again?
Yes, historical trends show the stock market has rebounded after downturns. With sound economic conditions and consistent investor confidence, future market rises are likely.
Is the US stock market recovering?
The US stock market shows signs of recovery with improving economic metrics and cautious investor optimism. Recovery progress can vary as it is linked to broader financial influences.
More from Politics
 Trends
Insurance Financial Trends: Bold Market Optimism
 Digital
Open Banking And Digital Banking Convergence: Bright Promise
 Risk
Correlation Breakdown And Portfolio Risk: Robust Outlook
 Tech